DeepLoop Team · 2026-09-14
The Layer Curve: Peak Is Not the Number That Pays
Almost every layer flock climbs to nearly the same peak - Lohmann puts LSL-Lite at 95-97% and Brown-Classic at 94-96%, both reaching 50% lay at 140-145 days. Peak is the easy part. What separates two flocks is everything that happens after it.
Persistency is the number that pays
After the peak the curve only goes one way - down. Persistency is how slowly. Read it straight off Lohmann's Table 18: an LSL-Lite holds 90%+ hen-day lay for 38 weeks; a Brown-Classic for 29. Same peak, nine extra weeks of near-peak laying - sitting in the part of the curve nobody sets as a target. It is not a footnote to the peak; it is the number that decides whether the flock pays.
More eggs is not more egg mass
Over a cycle to 95 weeks LSL lays 445 eggs to Brown's 430 - yet Brown's eggs are heavier (65.2 g vs 61.9 g average), so Brown edges total egg mass, 28.02 kg vs 27.57 kg per hen housed. As the laying rate falls, egg weight keeps climbing. The two move in opposite directions, so egg mass holds up long after egg number starts sliding - and you cannot read the flock off the lay percentage alone.
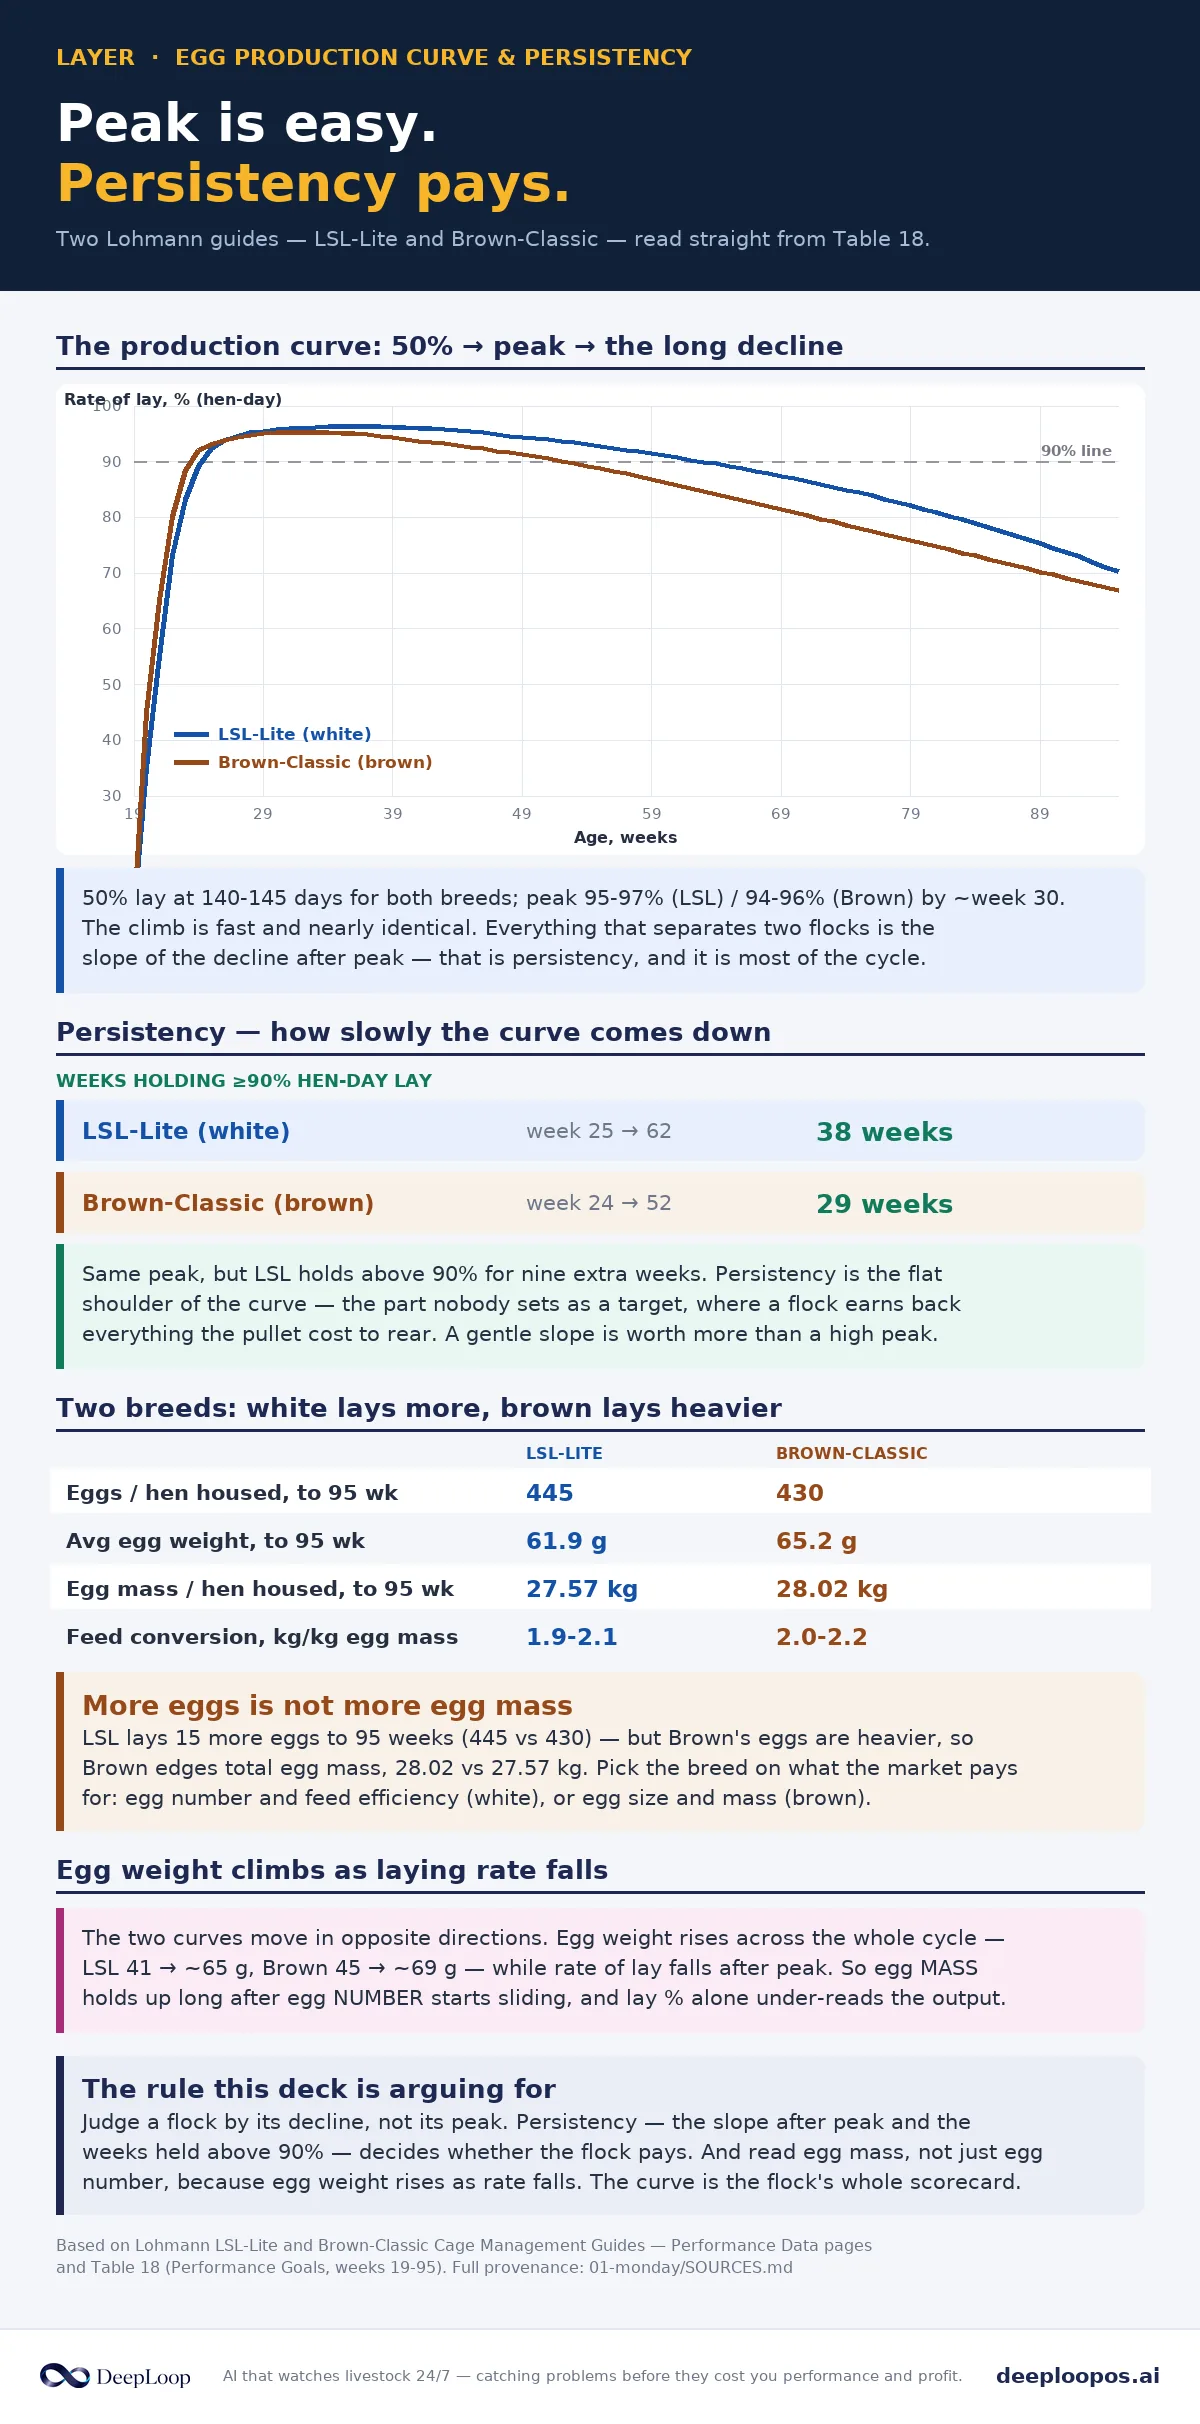
Rise to peak and persistency by breed - LSL-Lite vs Brown-Classic hen-day lay held above 90%, redrawn from Lohmann.
The drop you see is already days old
An Australian team took the curve seriously as something you could forecast: four commercial free-range farms, 106 flocks, 35,346 flock-days, forecasting against the Lohmann Brown target curve. A Random Forest trained on one farm's history forecast the laying rate at a median AUC of 0.86 and RMSE of 2.8 - and a model trained only on three other farms forecast the target farm nearly as well (AUC 0.89). The curve is regular enough to transfer between farms. But pooling everything did not consistently help: the combined model gave the best regression error (RMSE 2.55) and the weakest drop detection (AUC 0.82). More data, not automatically more skill.
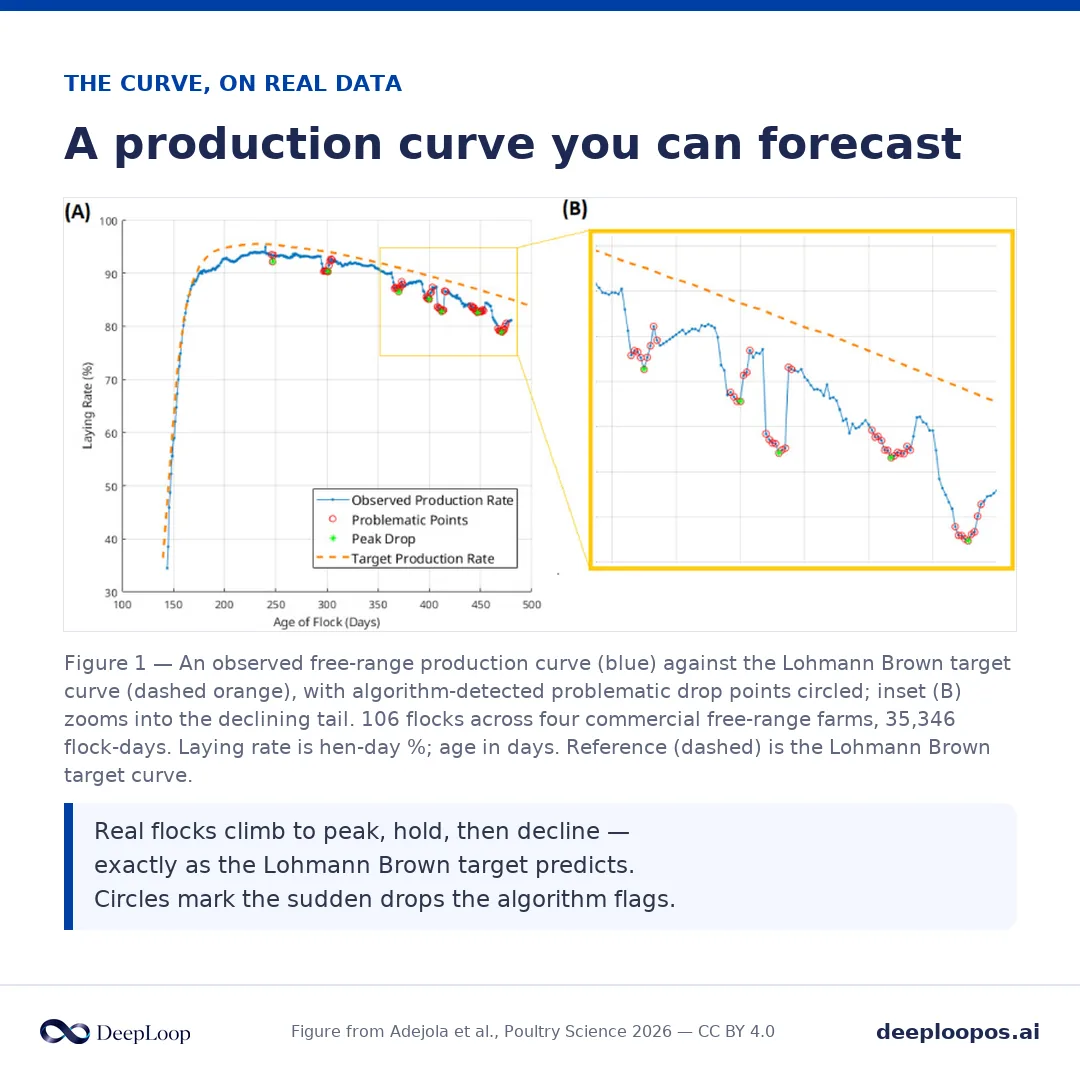
From the forecasting study - the production curve is regular enough to transfer between farms, but a drop shows in the average days after it starts.
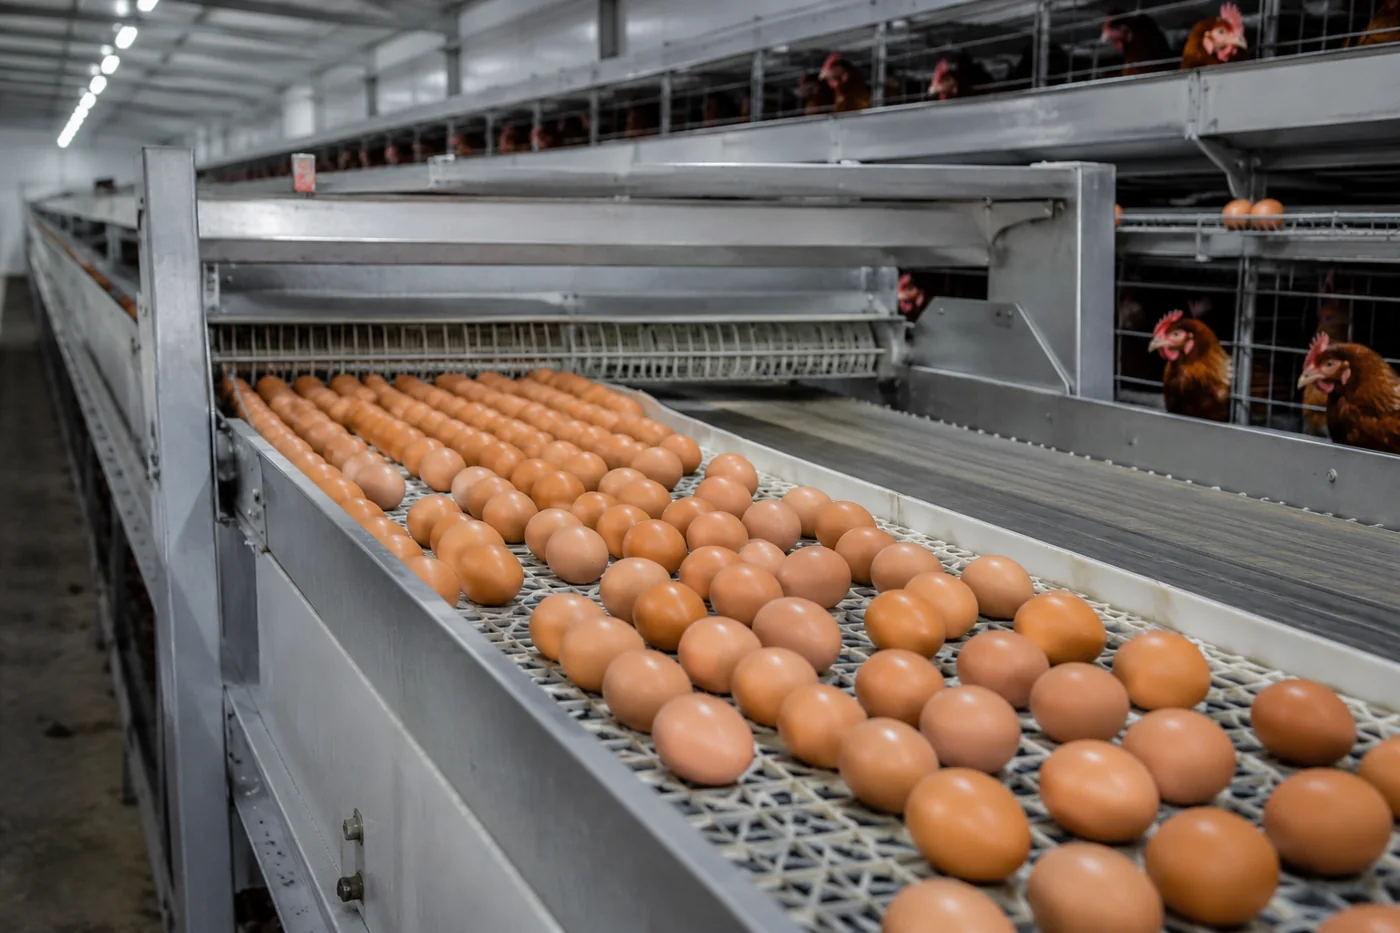
Which birds are still on the belt
Every number here is a flock average read once a day. The average hides the question that decides persistency: not what the flock does, but which individual birds are still laying and which have quietly dropped out. A curve that looks like a gentle decline can be a shrinking number of hens laying well - and the average will not tell you which.
Where this is heading
DeepLoop is working on the layer of this curve nobody plots - not the flock average once a day, but which birds are still on the belt. Persistency is a per-bird story, and reading it early is the difference between managing the decline and being surprised by it.