DeepLoop Designer - Free 3D Barn Design and Ventilation Sizing
DeepLoop Designer is a browser tool that lets you lay out a pig or poultry house in 3D and get its ventilation, heating, cooling and equipment list dimensioned from proven physics, measured fan test data and the real climate of the site you build on.
Draw the house, set species, stocking and target climate, pick the site on a map - the engine returns air requirement, fan banks, inlets, tunnel speed, pad cooling, heating load and emergency ventilation, with a bill of materials and a PDF you can hand to a contractor. Available in 86 languages.


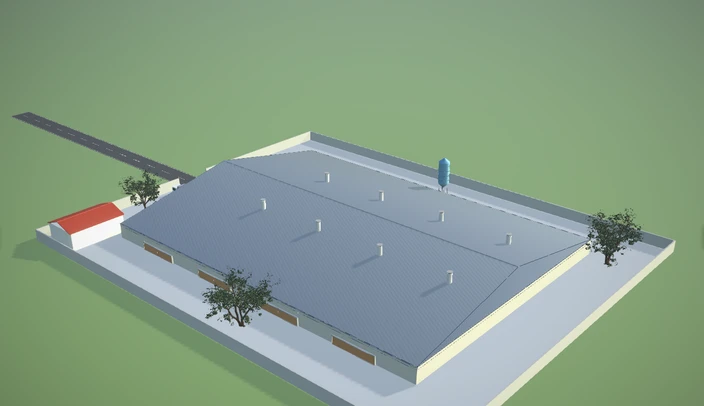
The whole house, in 3D
Build the shell, sections, pens or cages, inlets, fans, chimneys and pad walls in the browser. What you draw is what gets dimensioned - geometry, cross-section and maximum tunnel width are checked against the same standards, so an unworkable layout is flagged while you are still drawing it.
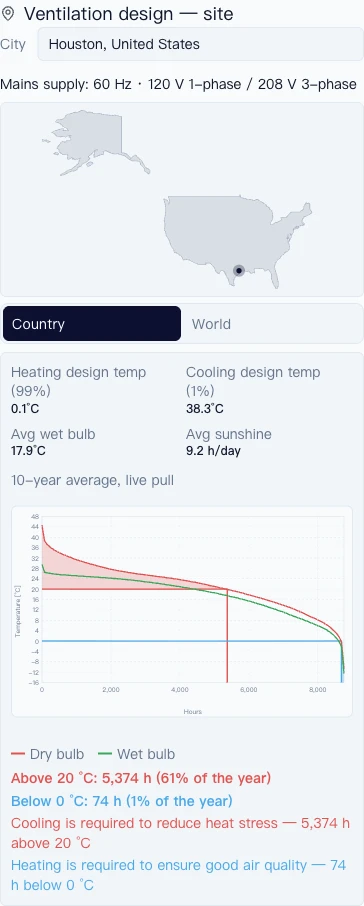
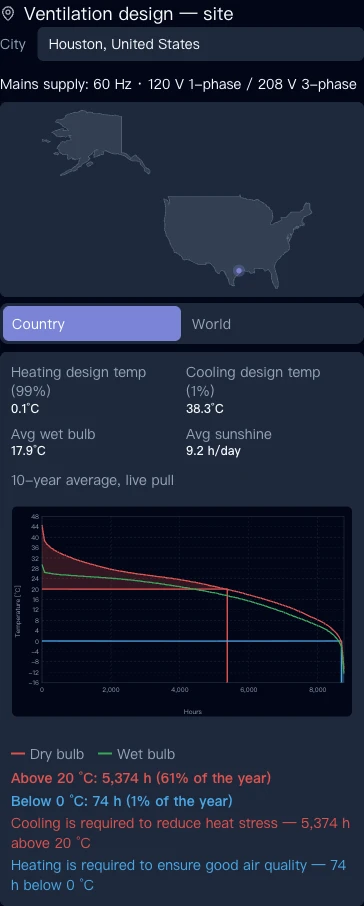
Real climate for your actual site
Pick your city and the engine loads its own climate profile: design heating and cooling dry-bulb temperatures, average wet-bulb, sun hours and a full temperature-duration curve. 31,942 cities across 243 countries from NASA POWER, and 337 Chinese cities with prebaked duration data.
- Source
- Design temperatures and temperature-duration curves
- NASA POWER climate records - 243 countries
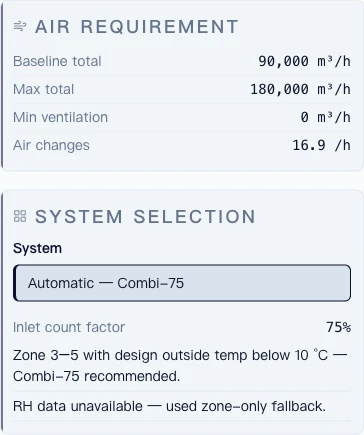
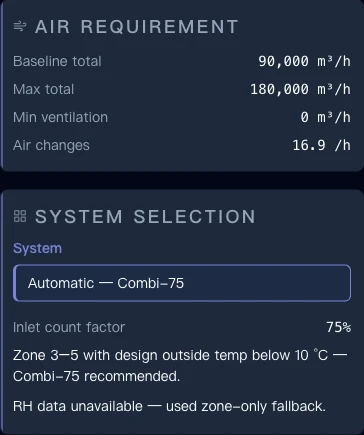
Air requirement and system picked for you
Baseline and max air requirement come from the bird count, weight and climate. The engine then recommends a ventilation system automatically. Combi-75, Combi-50 or pure tunnel, based on your climate zone and design outside temperature, not a fixed default.
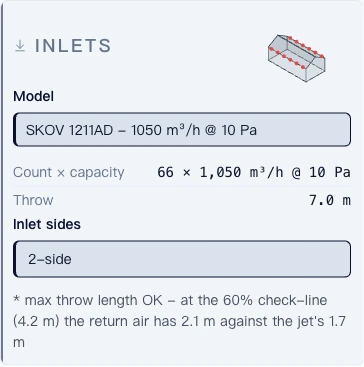
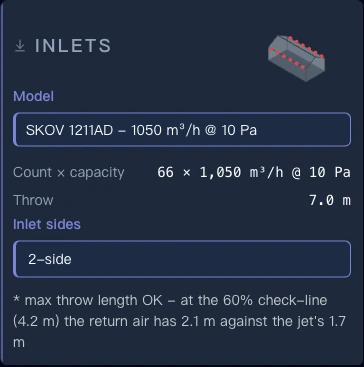
Inlet sizing checked against real hardware
Pick an inlet model and the throw, count and side placement are checked against the house width. The max throw length check runs at the 60% check-line automatically, so a jet that will not reach the far wall is flagged before you build it, not after.
- Source
- Fan capacity at design static pressure
- BESS Lab, University of Illinois - 1,051 published fan test reports, 70+ manufacturers
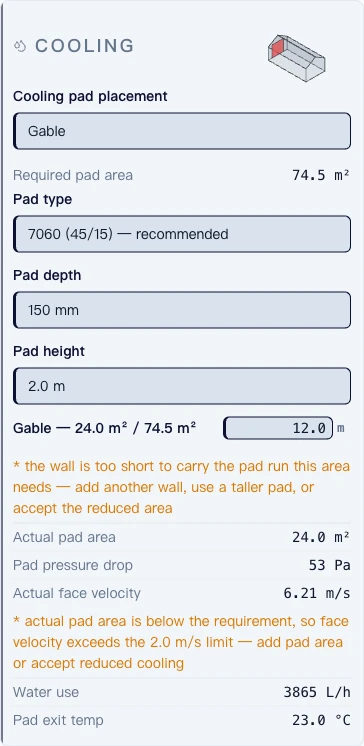
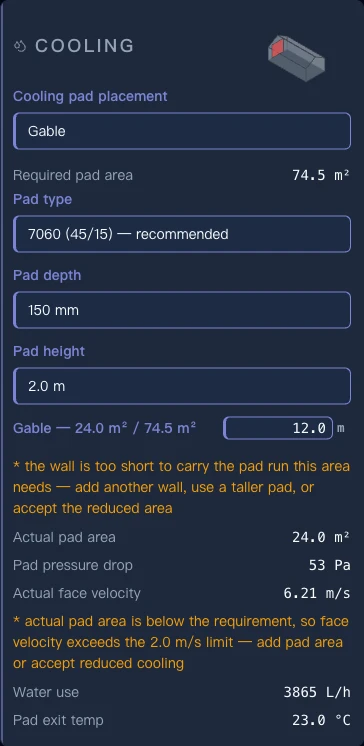
Cooling pad sized to the wall you actually have
Set a pad type, depth and height and the engine works out the required pad area for your climate, then checks it against how much wall is actually there to carry it. Short a wall and it says so, with the resulting face velocity and water use.
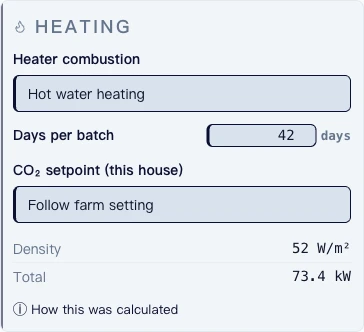
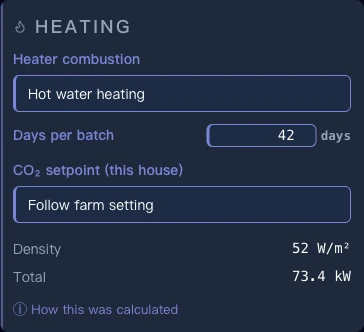
Heating load from a real heat balance
Heating capacity is not a rule of thumb. It comes from a full heat, moisture and CO2 balance on the Stroem/Feenstra bird-heat curve, with CIGR 2002 selectable, run against your batch length and CO2 setpoint.
- Source
- Animal heat and moisture production
- Strøm/Feenstra Φ = k·√m (default); CIGR 2002, Working Group on Climatization of Animal Houses (selectable)
- Psychrometrics - enthalpy, humidity ratio, wet-bulb
- Standard ASHRAE moist-air equations, Magnus-Tetens saturation vapour pressure
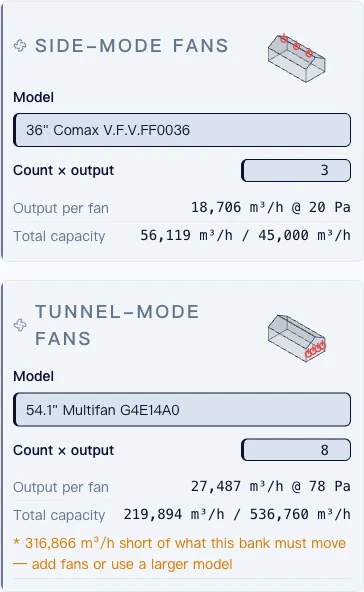
Real fan data from BESS Lab
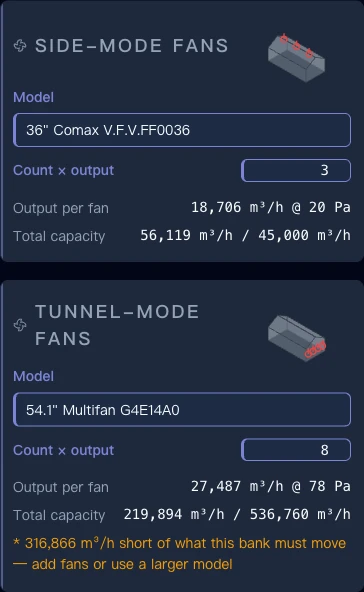
Fans come from 1,051 independent test reports (984 at 60 Hz, 67 at 50 Hz) published by the BESS Lab at the University of Illinois, covering 70+ manufacturers. Capacity is read from the measured pressure-airflow curve at your design static pressure - not from a catalogue headline number measured at zero pressure.
- Source
- Fan capacity at design static pressure
- BESS Lab, University of Illinois - 1,051 published fan test reports, 70+ manufacturers
Do I need to be a ventilation engineer to use it?
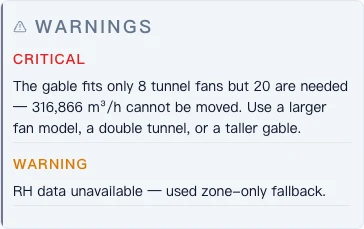
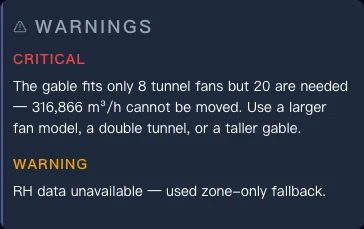
No. You draw the house and state the animals, target temperature and site. The engine applies the standards and warns you when a choice breaks one - for example when tunnel air speed, inlet area or house width falls outside the validated range.
Bill of materials and PDF export
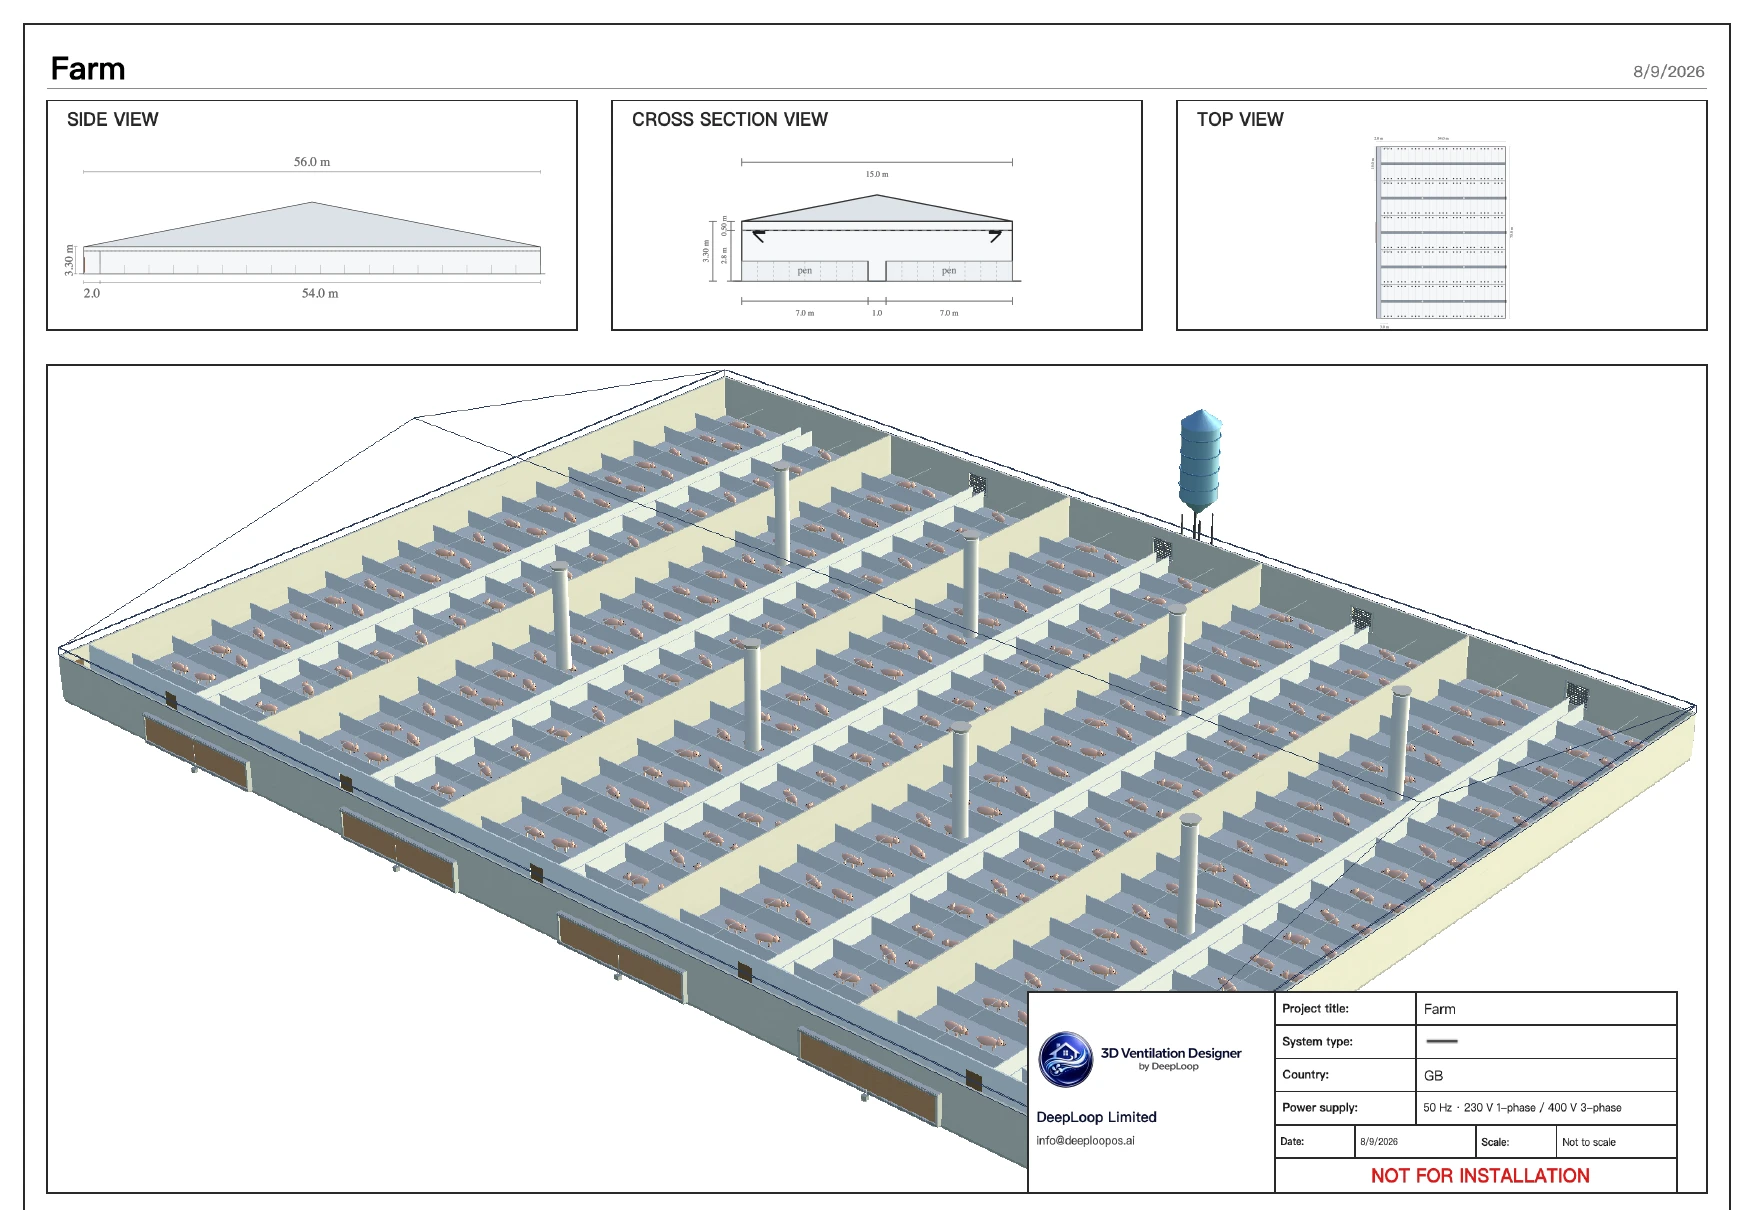
Every design produces an itemised equipment list and a printable report - fan models and counts, inlet area, heating capacity, cooling pads, emergency ventilation - that a supplier or installer can quote from directly.
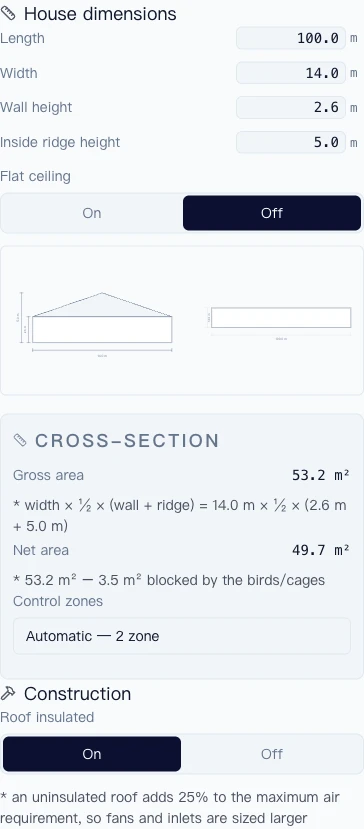
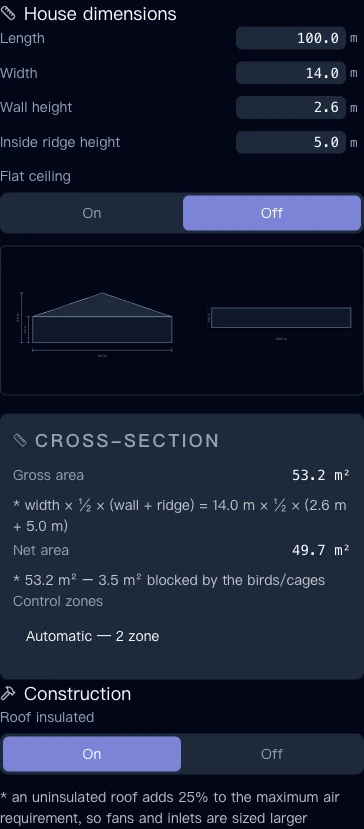
Cross-section and construction, not just a footprint
Gross and net cross-sectional area are derived from wall height, ridge height and width, minus what the birds or cages block. Turn off roof insulation and every downstream number, fans, inlets, heating, resizes for the 25% penalty.
Pigs and poultry
Weaner, finisher, farrowing, gestation, gilt, boar and mating rooms, plus broilers and broilers in cage - each with its own heat and moisture production, so the same house geometry sizes differently for the animals you actually put in it.
Pricing
Free to start, same as Drive or Dropbox. Pay only when you outgrow the free tier's design cap.
| Tier | Price/yr | Saved designs | Climate history | PDF watermark | White-label logo | Team collaboration |
|---|---|---|---|---|---|---|
| Free | $0 | 10 max | 686 cities (1 year) | Yes | No | No |
| Pro | $365 | 300 max | 5,858 cities (3 years) | No | No | No |
| Pro Max | $3,650 | 5,000 max | 32,279 cities (10 years) | No | Yes | Yes |
| Enterprise | Custom | Unlimited | 32,279 cities (10 years) | No | Yes | Yes |
Share links stay free and unlimited on every tier. Public design views always carry DeepLoop branding, even on Enterprise.
Where the numbers come from - every source is public
| Input | Source |
|---|---|
| Animal heat and moisture production | Strøm/Feenstra Φ = k·√m (default); CIGR 2002, Working Group on Climatization of Animal Houses (selectable) |
| Psychrometrics - enthalpy, humidity ratio, wet-bulb | Standard ASHRAE moist-air equations, Magnus-Tetens saturation vapour pressure |
| Fan capacity at design static pressure | BESS Lab, University of Illinois - 1,051 published fan test reports, 70+ manufacturers |
| Design temperatures and temperature-duration curves | NASA POWER climate records - 243 countries |
Is DeepLoop Designer really free?
The Free tier is free. Designing, dimensioning, and exporting a bill of materials and watermarked PDF, up to 50 saved designs. Pro, Pro Max and Enterprise (see pricing above) raise that cap and add unwatermarked, white-label PDFs and shared team libraries.
Are the sources public?
Yes. The heat-production curves (Strøm/Feenstra, CIGR 2002), the ASHRAE psychrometric relations, the BESS Lab fan test reports, NASA POWER climate records and the GeoNames gazetteer are all published, independently checkable data. Nothing in the sizing rests on a number you cannot look up yourself.
Why does measured fan data matter?
A fan's catalogue airflow is usually quoted at zero static pressure. A real house runs at 10-40 Pa, where the same fan moves far less air. Reading the measured BESS Lab curve at your design pressure is the difference between a house that holds its target temperature in summer and one that does not.
Which climate data is used?
Each city carries design heating and cooling dry-bulb temperatures, average wet-bulb, average daily sun hours and a temperature-duration curve derived from multi-year NASA POWER records, so cooling is sized against how often it is actually hot at your site - not against a single worst-case number.
How does it relate to DeepLoop OS?
Designer is where the house is planned; DeepLoop OS is what runs and watches it afterwards with camera-based AI monitoring and climate control. The two share the same model of the house, so a design carries straight into operation.
Why does the cross-section matter, not just the footprint?
Gross and net cross-sectional area come from wall height, ridge height and width, minus what the animals or cages actually block - not just length times width. Turn off roof insulation and every downstream number, fans, inlets, heating, resizes for the 25% penalty, because the engine works from real airflow geometry, not a floor-plan guess. Two houses with identical footprints but different wall heights or roof insulation choices can need different fan counts - a footprint-only estimate would size both the same and get one of them wrong.
What do I actually get in the output?
A full bill of materials and a PDF export for every design. The Free tier watermarks the PDF and caps you at 50 saved designs; Pro, Pro Max and Enterprise remove the watermark, add a white-label PDF, and raise or remove the save limit - see pricing above. The bill of materials lists every fan, inlet, pad and heater model by name and count, sized against the same standards as the rest of the design, so it can go straight to a supplier for a quote rather than needing to be rebuilt by hand.
Does this replace an engineer's sign-off?
No. Designer sizes ventilation, heating and structure against published standards (CIGR 2002, ASHRAE, BESS Lab, Strøm/Feenstra) and flags anything outside the validated range, but it is a sizing tool, not a stamped engineering drawing - use it to get the numbers right before you brief your engineer or fabricator, not to skip them. Local building codes, structural load requirements and electrical certification are outside its scope entirely; those still need a licensed engineer in your jurisdiction, the same as they would with any sizing spreadsheet.
Can I design a whole farm, multiple buildings?
Yes. Site and climate are set once per farm and shared across every house you add to it.
CAD import or export?
No, not yet - working on it, planned for a future release.
What if my city isn't in the database?
It falls back to an enthalpy-based climate estimate automatically, or you can manually override the climate zone yourself.
Metric or imperial?
Both - everything is stored in metric internally, imperial is a display-only conversion.
Is my design private?
Private to your organization by default; only your org's admins see it unless you generate a share link yourself.
Can I model an existing barn for retrofit?
Yes - one of the real published example designs is a tunnel retrofit at an existing farm. There's no separate "retrofit mode", you just model the barn as it stands.
The 0.01-0.03% accuracy claim - validated against what?
Checked line-by-line against 42 independently published barn-dimensioning reports - same inputs in, comparing our temperature correction, sensible/latent heat split and fan sizing against theirs, sheet by sheet. Median error 0.01-0.03% on the physics, ~1.4% once you chain all the way through to final airflow.
Is there tutorial material?
Yes - in-app onboarding hints plus a full user manual walking through every section of the app.